DevTools
<QueryDevTools> is a Blazor component that renders a live view of the DotNetQuery cache directly inside your browser. It is shipped as a separate NuGet package so it is never pulled into production builds unless you explicitly reference it.
Installation
Add the DevTools package to your Blazor project:
dotnet add package DotNetQuery.Blazor.DevTools
Then add the namespace to your _Imports.razor:
@using DotNetQuery.Blazor.DevTools
Adding the Component
Place <QueryDevTools> in your MainLayout.razor. Use IHostEnvironment to limit it to development so it is excluded from production:
@* MainLayout.razor *@
@inherits LayoutComponentBase

@using DotNetQuery.Blazor.DevTools
@inject IHostEnvironment Env

@if (Env.IsDevelopment())
{
    <QueryDevTools />
}

<div class="page">
    @Body
</div>
That is the only change required. No configuration, no DI registration — the component reads from the IQueryClient that is already registered in your container.
Multi-layout apps: If your app has more than one layout, add
<QueryDevTools>to each one, or extract it into a shared parent layout that the others inherit from.
Features
Cache overview
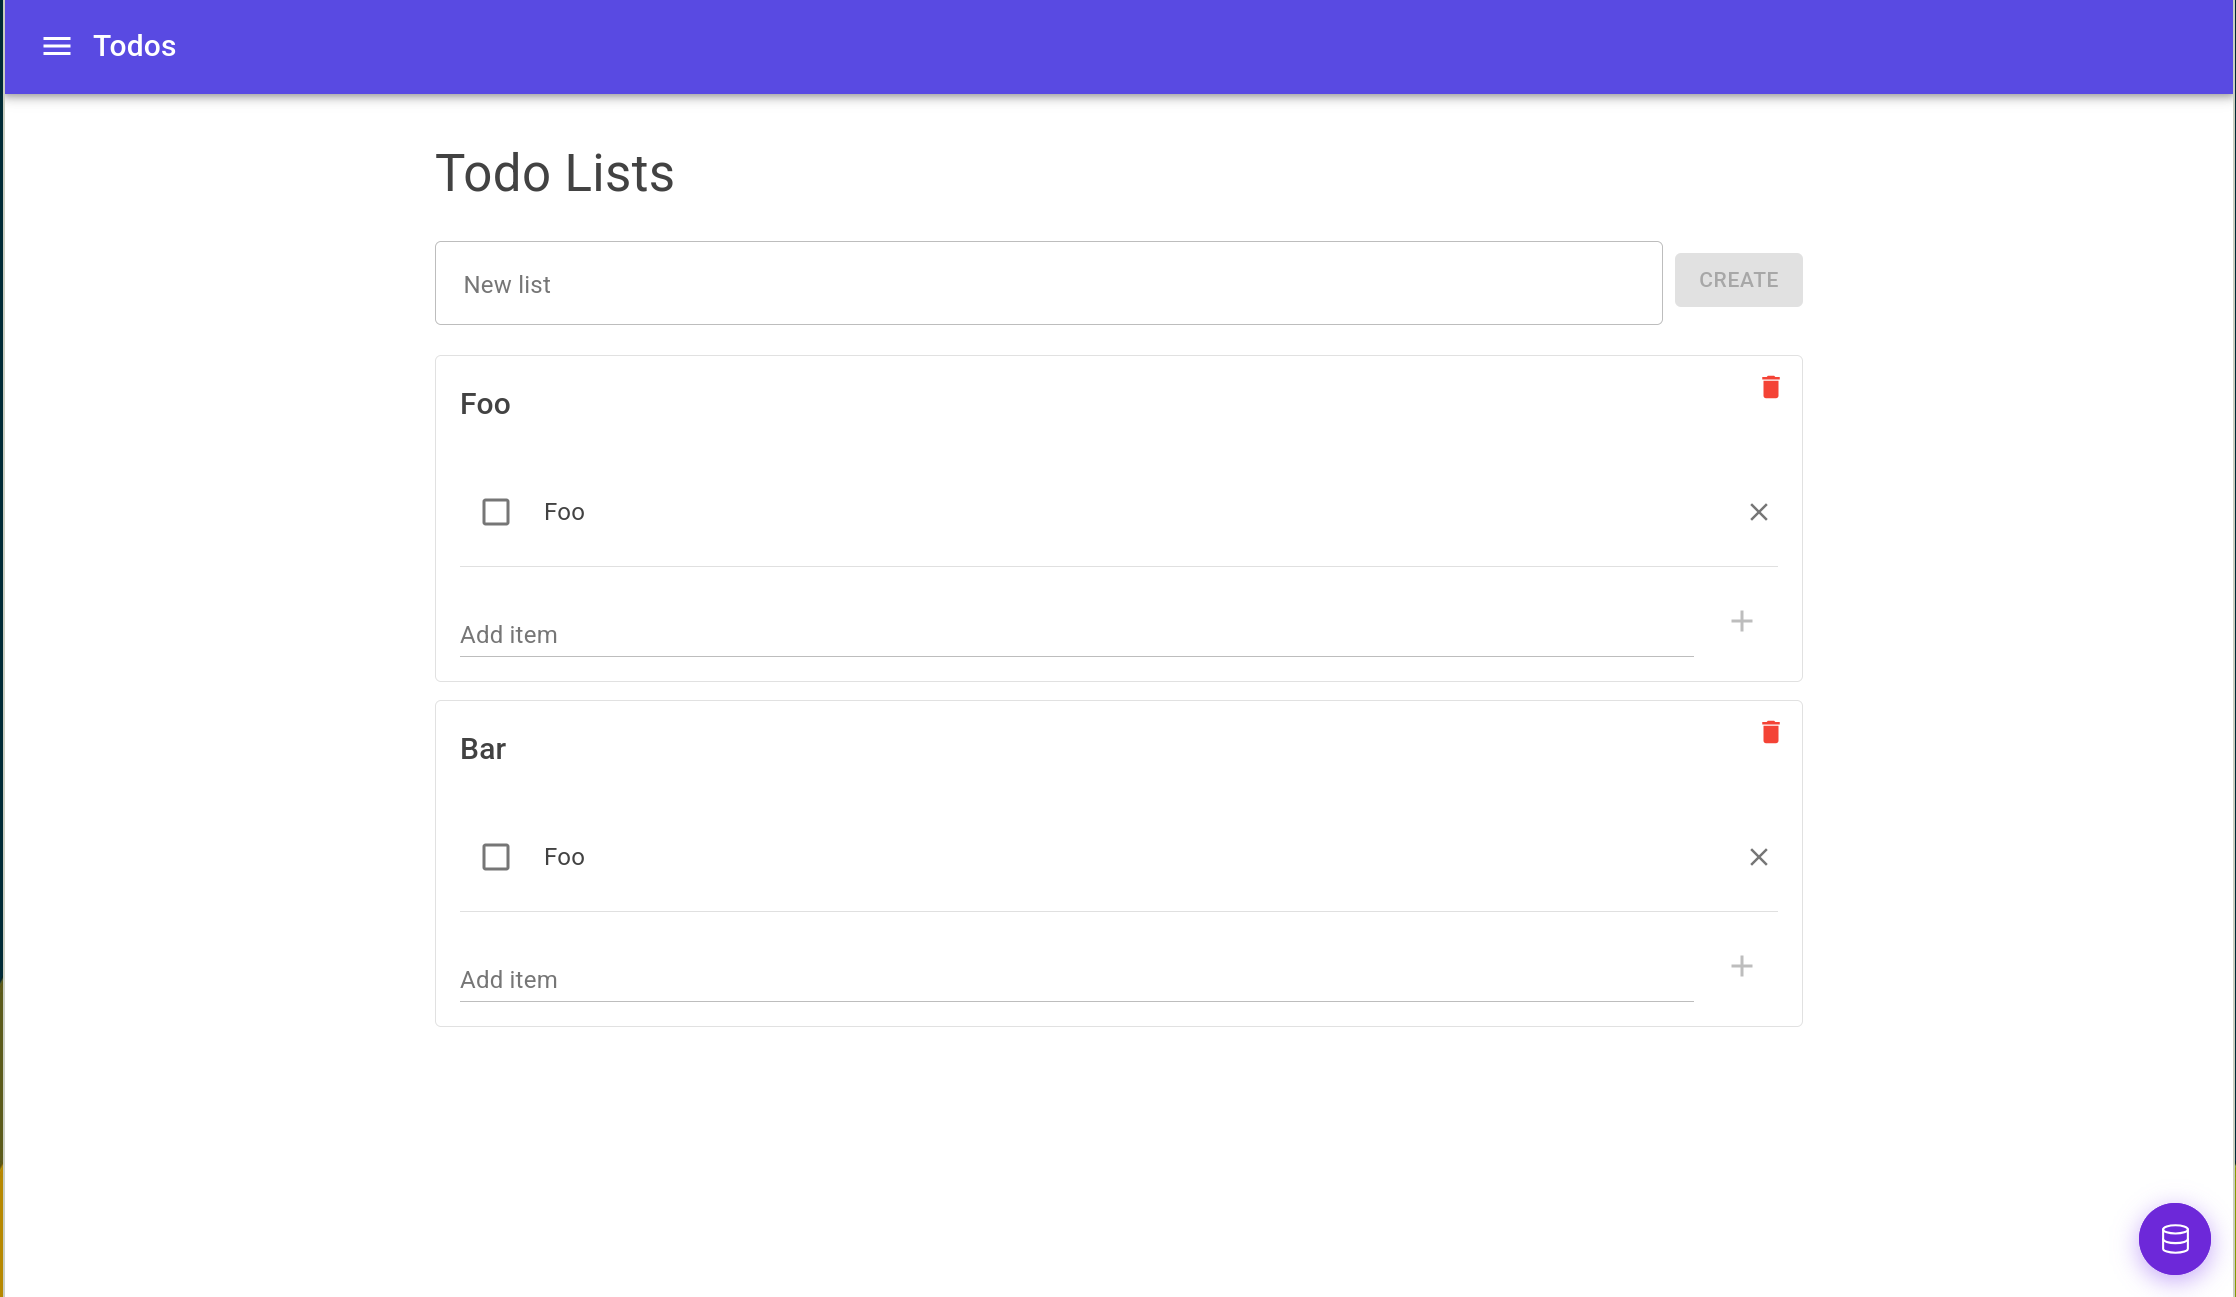
When the panel is closed, a floating button appears in the bottom-right corner. Click it to open the panel.
The panel header shows live badge counts for each status:
| Badge | Meaning |
|---|---|
| Fetching | A network request is currently in flight. |
| Success | Data was fetched successfully and is in cache. |
| Idle | The query exists in cache but has not yet been triggered. |
| Failure | The last fetch attempt failed. |
| Total | Total number of entries currently in the cache. |
Query list
The left side of the panel lists every query currently in the cache. Each row shows:
- A status pill (color-coded: blue = fetching, green = success, gray = idle, red = failure).
- The observer count — how many components are currently subscribed to this query.
- The full query key string.
Filtering
Type in the search box to filter the list by key. The filter is case-insensitive and matches any substring of the key.
Detail panel
Click any row to open the detail panel on the right. It shows:
| Field | Description |
|---|---|
| Status | Current status of the selected query. |
| Observers | Number of active subscribers. |
| Last Updated | Timestamp of the last successful fetch (local time, HH:mm:ss.fff). |
| Cache Time | How long data stays in cache after all subscribers leave. |
| Data | The cached data, pretty-printed as JSON. While a refetch is in flight or after a failure, the previous data is shown instead of going blank. |
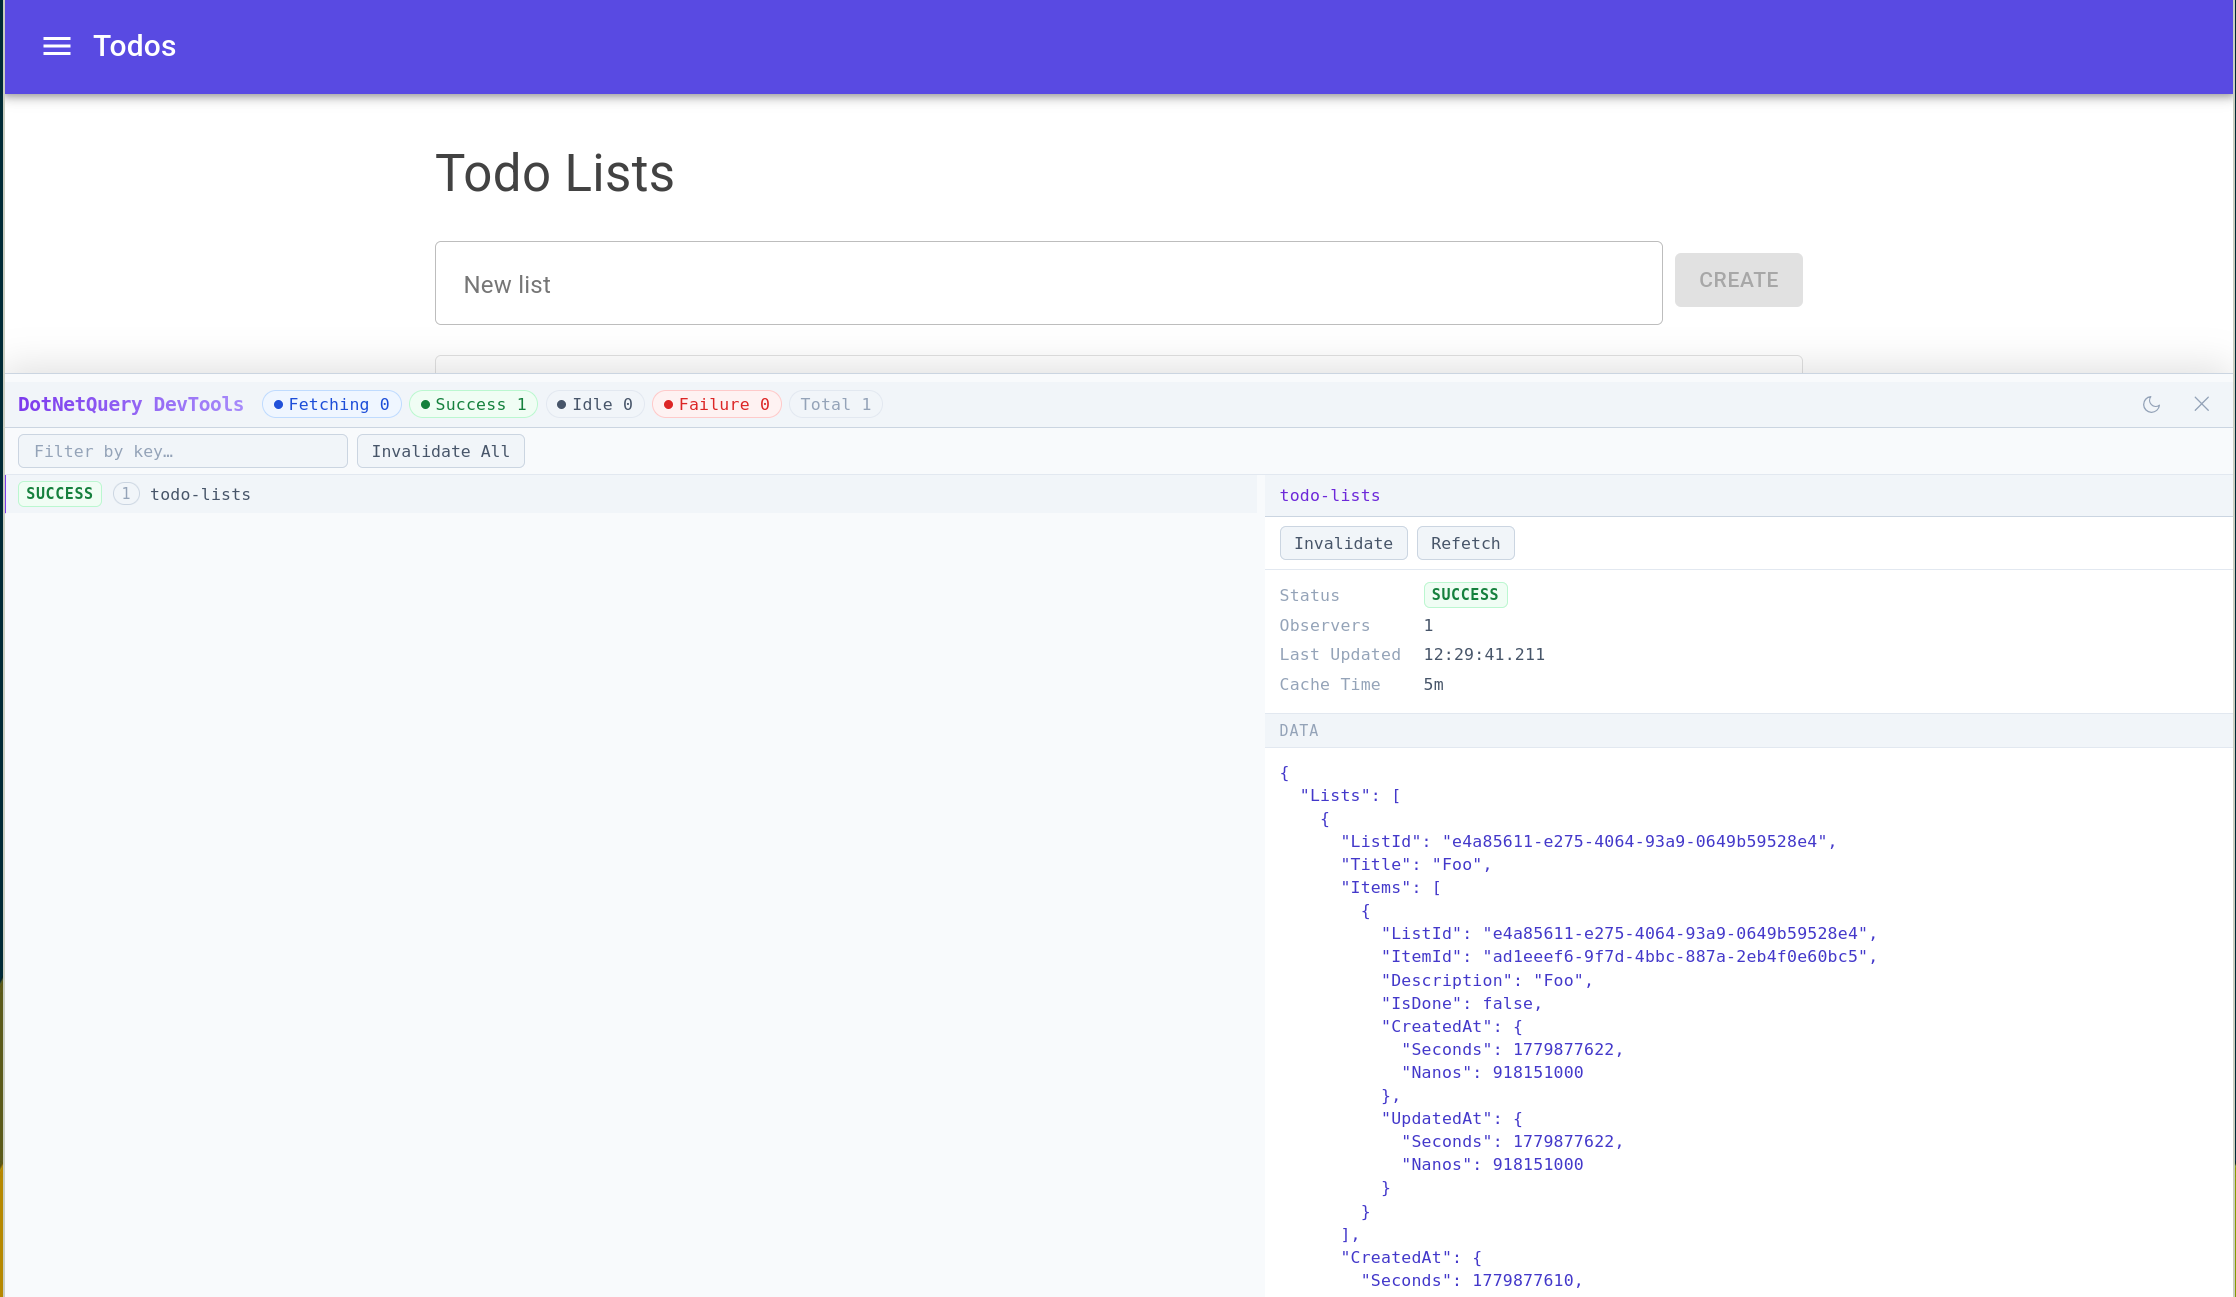
Two action buttons are available:
- Invalidate — marks the query stale and triggers a background refetch immediately.
- Refetch — forces a new network request regardless of staleness.
Click the selected row again to close the detail panel.
Invalidate All
The toolbar also provides an Invalidate All button that invalidates every query in the cache at once — useful for forcing a full refresh during manual testing.
Resize
Drag the handle at the top edge of the panel to adjust its height.
Notes
<QueryDevTools>requires an interactive render mode (Blazor WASM or interactive Blazor Server). It has no effect under static SSR becauseOnAfterRenderAsyncnever runs in that mode.- The panel reads the cache through
IQueryClient.TryGetInspector. IfIQueryClientis registered with a custom implementation that does not implementIQueryCacheInspector, the component silently renders nothing. (In 2.0.0 this interface was internal; it is public from the upcoming 3.0.) - Not on Blazor? The same inspection API is public in
DotNetQuery.Corefrom the upcoming 3.0. See Building a Cache Inspector.